Cost per sale down 14%
on 32% more spend.
A US DTC loungewear brand had watched its cost per sale climb for three straight months. In the next 30 days it fell 14%, while spend went up a third. I owned the Meta channel: strategy, creative direction and the testing system.
The result
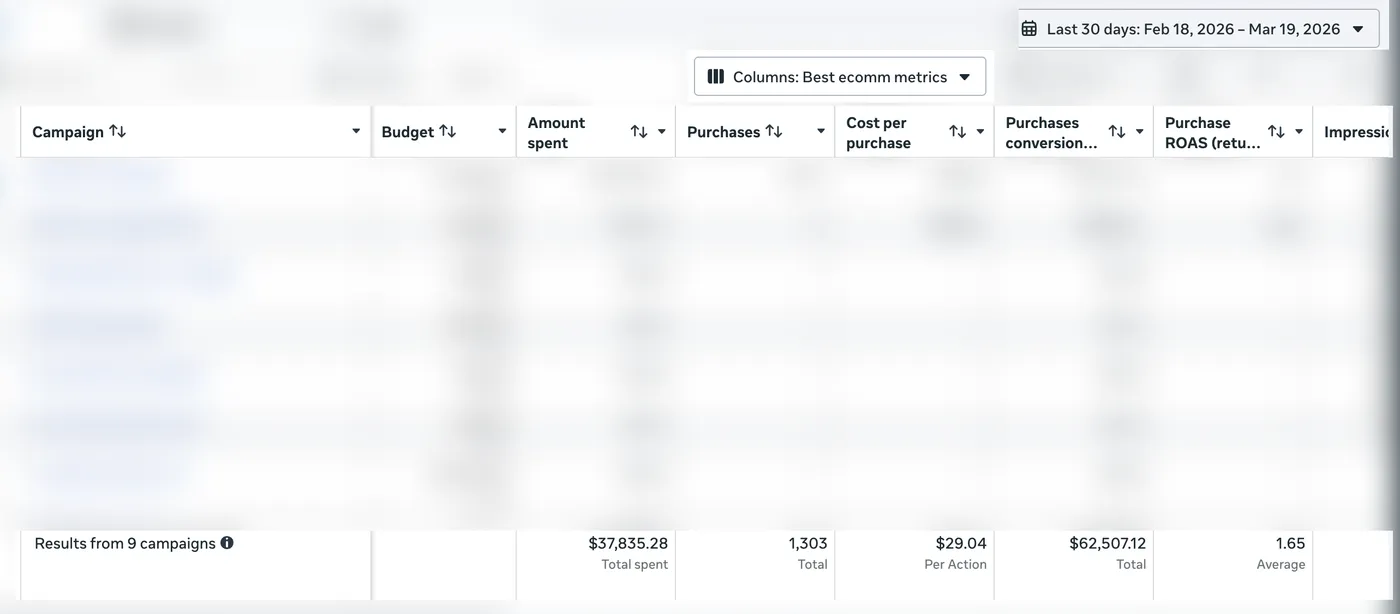
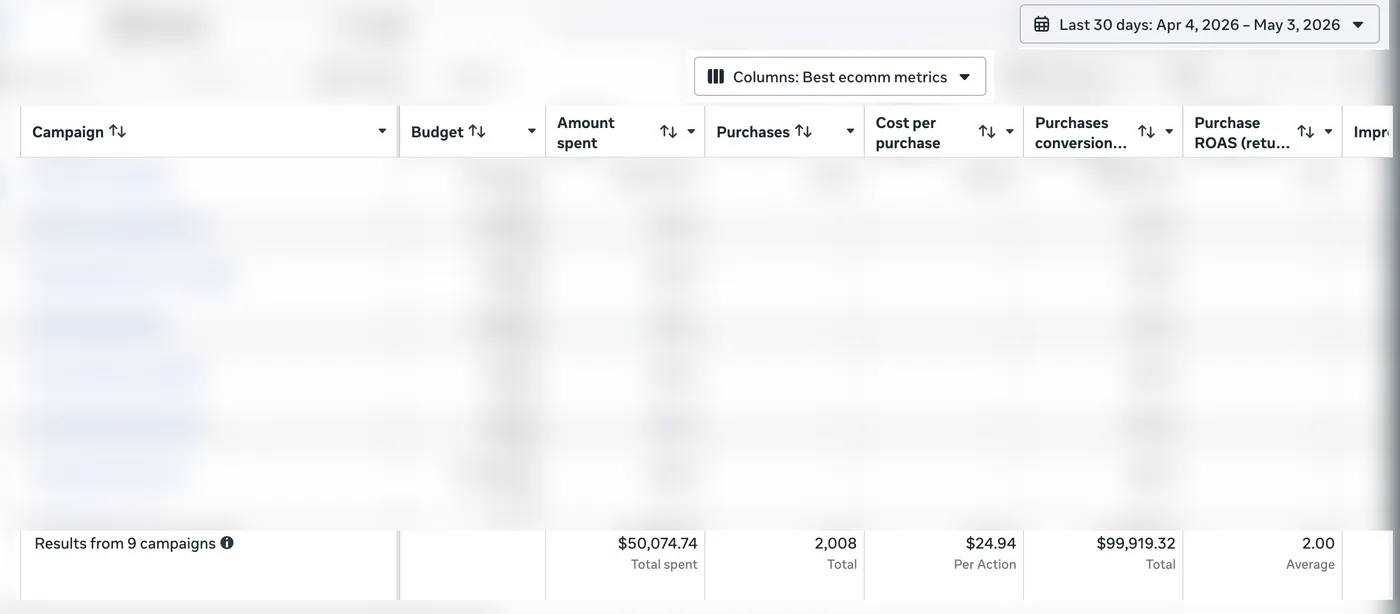
| Ad spend, 30 days | Cost per purchase | Purchases | ROAS |
|---|---|---|---|
| $37,835 → $50,075 | $29.04 → $24.94 | 1,303 → 2,008 | 1.65x → 2.00x |
| +32% | down 14% | +54% | +21% |
Why this was hard
Spending more is easy. Spending more without paying more per customer is the part that breaks. Every account reaches a point where the next dollar buys a worse customer than the last one. Most operators treat that as physics and budget for the decline. This account went the other way.
The diagnosis
It was a slope, not an event.
| Ad spend | Purchases | Cost per sale | ROAS | |
|---|---|---|---|---|
| January | $34,968.25 | 1,342 | $26.06 | 1.84x |
| February | $57,487.10 | 2,100 | $27.37 | 1.81x |
| March | $42,577.96 | 1,516 | $28.09 | 1.70x |
February is the month worth staring at. It is the account's seasonal peak, it ran the highest spend of the year through Valentine's Day, and it still paid more per sale than January did. More money in, worse economics out, in the best demand month on the calendar.
What I ruled out first: the site (add to cart, checkout starts and checkout completion were all in healthy bands) and the offer (stable and consistent for months). That left the ads. My read at the time: at around $10,000 a week, a small pool of concepts was landing in front of the same people too often, and the auction was charging for it. Click costs had drifted from $1.48 across the account's history toward roughly $1.75. That read turned out to be half right.
What I changed
Three moves. None of them touched the website.
Rebuilt the customer model on receipts instead of assumption. The ads spoke to the woman who wears the product. The purchase data said the person paying was usually a man buying it for her. Males 35 to 44 were the largest single band of buyers at 37.3% of all purchases. That segment was not outperforming, running $27.55 per sale against the account's lifetime average of $27.58. The win was that every ad had been written for the wrong half of the transaction, and that capped how different any two ads could be.
Split one buyer into four reasons. The one with no idea what to get. The one who got it wrong last time. The quiet romantic. The overthinker. Each was built for where he actually was, from never considered this product to already comparing two of them. Not more ads. More genuinely different ads.
Made each test produce a decision. Every brief carried a written hypothesis and a kill condition before anything was made. Results were read against the bar the test launched on, not against how the ad felt.
The results
Matched 30 day windows. March vs. April.
| Before | After | Change | |
|---|---|---|---|
| Ad spend | $37,835.28 | $50,074.74 | +32% |
| Purchases | 1,303 | 2,008 | +54% |
| Cost per purchase | $29.04 | $24.94 | down 14% |
| ROAS | 1.65x | 2.00x | +21% |
| Revenue from Meta | $62,507.12 | $99,919.32 | +60% |
The first ads from the rebuilt system went live at the end of March. The before window closes a week earlier, so none of my work ran inside it.
Why it worked, and the part I got wrong
I diagnosed this as a click cost problem. Click costs never really moved. In the final week, cost per click sat at $1.68 against $1.75 the week before, and click-through rate was flat, 1.23% against 1.27%. Measured against the diagnosis I started with, that is a miss.
Everything after the click is where it moved. Same week: conversion rate went from 4.49% to 6.01%, add to cart from 10.88% to 13.42%, checkout starts from 57.5% to 65.5%. That is one week, compared to the week before it, and it is the only window I have that data for. I am not going to dress it up as the whole picture.
But it points somewhere specific. The ads did not buy cheaper attention. They bought the right person's attention. The buyer was the variable. I had been treating the auction as the variable.
Two things I cannot rule out. April runs toward Mother's Day, which lands seven days after this window closes, so some of the lift is seasonal. And February scaled harder than April did, 64% over January against April's 32% over the before window, so February was carrying more strain when it slipped. What neither explains is February going backwards while spending more, in the bigger gifting month for this product.
The lesson
Scaling is not the problem. The question worth asking is what becomes the constraint when you spend more. It is rarely the same thing twice. Here it was that the ads were built for someone who was not the one paying, and no amount of budget fixes that. If your cost per sale has been climbing for months while your conversion rate holds steady, the leak is upstream of your site.
Book the 20-minute call.
Two questions, then pick a time. No pitch. Just clarity on where your account leaks.