$10k → $45.5k/mo in six months
One account, rebuilt from structure up. The client is a premium gaming-accessories DTC brand; they stay unnamed by agreement. The numbers are real.
The challenge
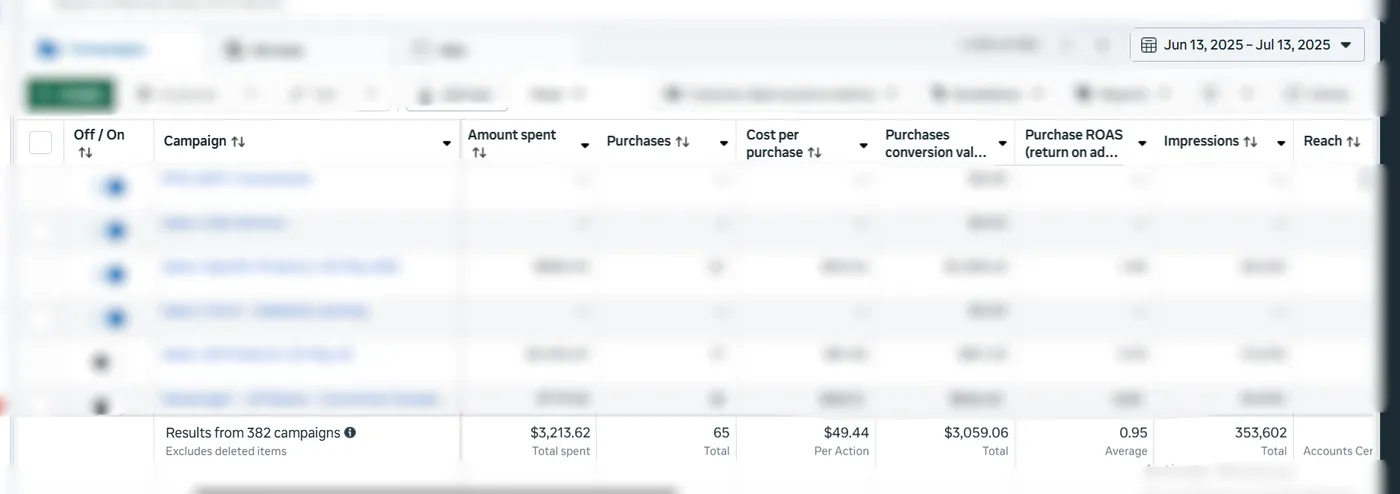
The account was losing money on every dollar. ROAS sat at 0.95, below break-even before a single other cost. The brand had real products and real demand, but every product had its own ad set. Budgets fragmented, nothing gathered enough signal to scale, and every new test started the account from zero. Scaling anything just scaled the loss.
The approach
Week one, nothing changed. I mapped where the money actually leaked: campaign structure, budget flow, which creatives had real signal behind them and which just looked good in a screenshot. The read was clear. This was a structure problem, not a creative one.
The execution
We rebuilt the account around consolidation: fewer, bigger ad sets so spend pooled instead of fragmenting, a testing lane so new creative earned its way into scale instead of resetting it, and budgets that followed proof. From there, creative testing ran on a steady cadence on top of structure that could hold it.
The result
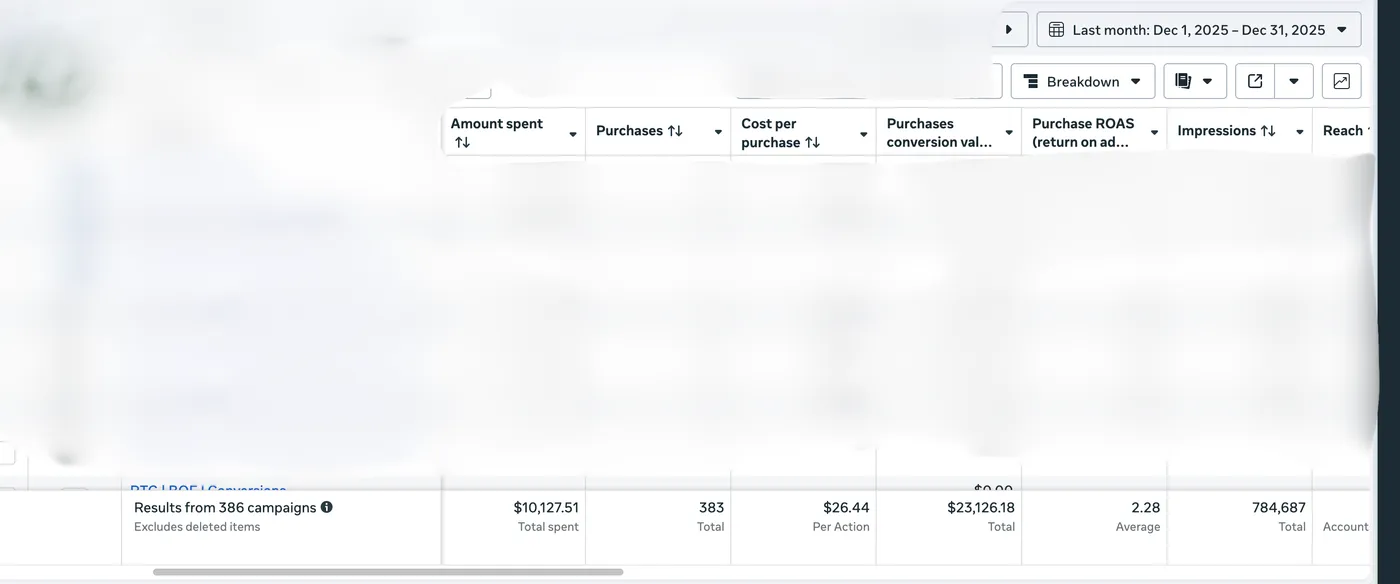
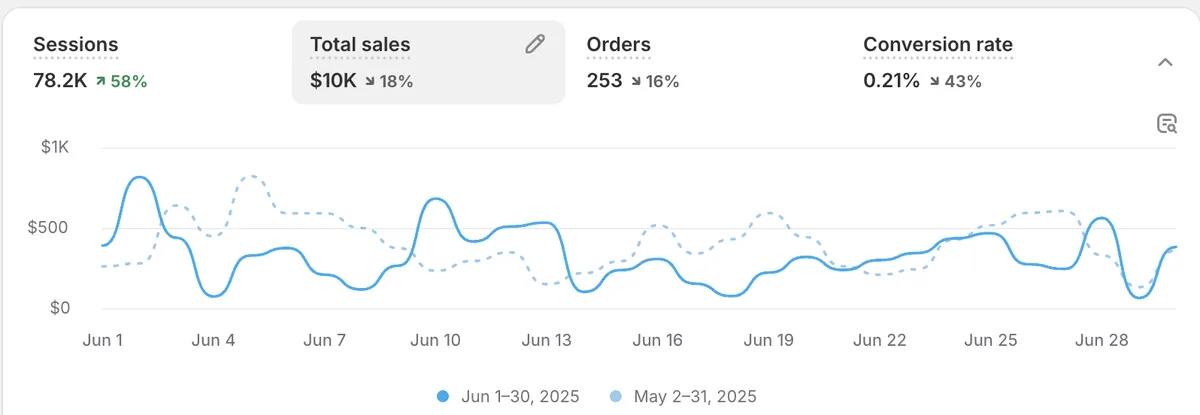
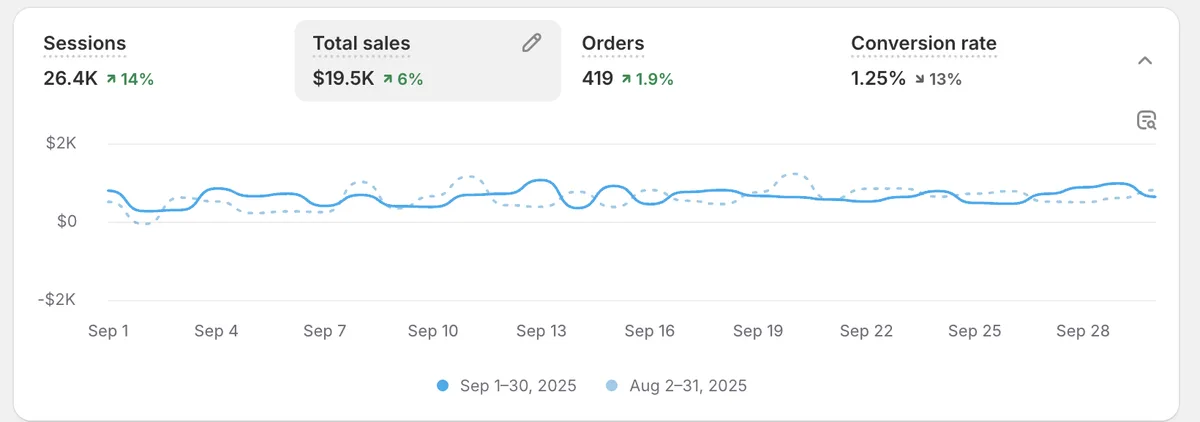
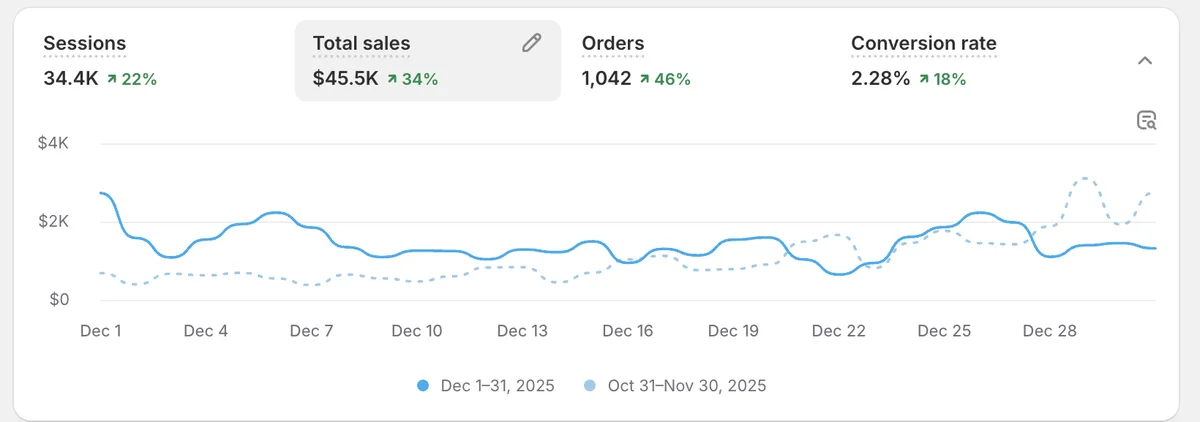
Revenue went from $10k to $45.5k/mo in six months. ROAS climbed from 0.95 to 2.28 while spend roughly tripled. Scaling usually wrecks efficiency. This didn't, because winners finally had room to compound.
Revenue is total store revenue; the ROAS covers Meta only, and Meta drove roughly a quarter of that store's sales. The two are not meant to multiply.
The part that matters more
A spike can be luck. A floor is structure. Revenue has held above $30k/mo since January 2026 (as of July 2026). As of September 2026 the weekly run rate is still above that floor.
Monthly store revenue: start, month six, and the floor since January 2026.
The same method on a loungewear brand: read the second case study.
Book the 20-minute call.
Two questions, then pick a time. No pitch. Just clarity on where your account leaks.